Cloud Architect Salary in Richland, WA: $160,089 (2026)
Quick Answer:A full-time cloud architect in Richland, WA earns a median $160,089/year (≈ $76.97/hour) in nominal terms for 2026 — projected from BLS OEWS 2025 (SOC 15-1241). Once you factor in Richland's price level (7% above national, BEA RPP 107.4), that paycheck buys what $149,059 would nationally. Nominal pay sits 2.1% above the Washington state average.
Based on BLS state-level estimates · View source
In 2026, a cloud architect in Richland, WA, is looking at a median annual salary of $160,089, which represents a competitive position compared to the national median of $148,828. With a salary range that spans from approximately $94,939 to $236,582, this variation reflects the structural choices between consulting firms and in-house enterprise roles. As businesses increasingly migrate to the cloud, the demand for cloud architects continues to rise, pushing salaries higher. The data, derived from 2025 BLS OEWS projections, indicates a healthy job market for this role within Richland, showcasing a direct correlation between employer type and compensation levels.
About the Richland Market
Salary estimated from Washington average ($172,000) adjusted for local cost of living.
Salary Breakdown
| Percentile | Annual | Hourly |
|---|---|---|
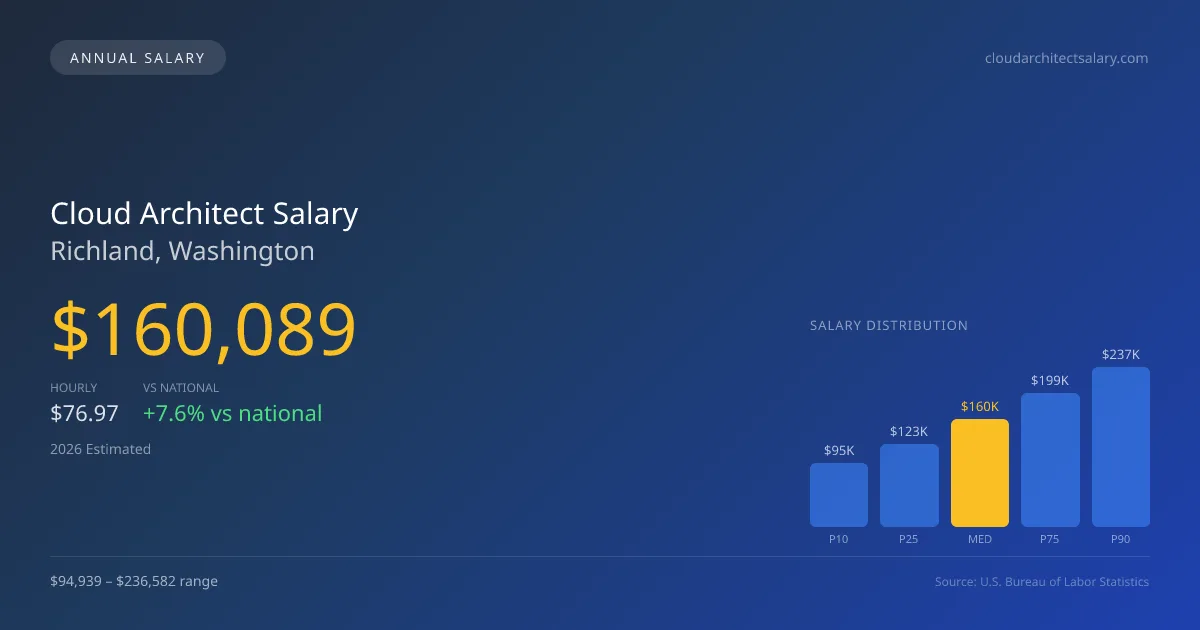
| Entry Level (P10) | $94,939 | $45.64 |
| Lower Range (P25) | $123,383 | $59.32 |
| Median (P50)(typical) | $160,089 | $76.97 |
| Upper Range (P75) | $198,791 | $95.57 |
| Top Earners (P90) | $236,582 | $113.74 |
Median Salary Position
7.57% above the national average
2026 Salary Percentile Distribution in Richland
In Richland, WA, the cloud architect salary spread from the 10th to 90th percentile is $141,643 (2026 est.). At $160,089, the local median is 7.57% above the national median of $148,828.
Salary Calculator
At 40 hours/week in Richland: You'd be in the lower-middle range
How Richland Cloud Architect Pay Compares
Richland median: $160,089/year (2026)
| Compared To | Median Salary | Richland Pays |
|---|---|---|
| Washington Average | $156,797 | +2.10% more |
| National Average | $148,828 | +7.57% more |
Cloud Architects in Richland, WA earn a median of $160,089 per year (2026 est.), which is 7.57% higher than the national median of $148,828 and 2.10% above the Washington state average of $156,797.
Cost-of-Living Adjusted Salary
Richland has a cost of living 7.40% above the national average.
Adjusted salary = nominal × (100 / CoL index). CoL index: 100 = national average.
Richland, WA has a cost-of-living index of 107.4 (above the national average of 100). While the nominal salary of $160,089 is competitive, the higher cost of living reduces purchasing power to an effective $149,059 — a 6.89% reduction.
Compare Purchasing Power
Select a city to see how your salary compares after cost of living
Select a city above to compare purchasing power
2019 BLS Actual
$130,915
2025 BLS Actual
$155,729
2026 Current Est.
$160,089
2019–2027 Growth
+25.7%
Salary Trajectory for Cloud Architects in Richland (2019–2027)
2019–2025: actual BLS OEWS data for this metro area. 2026+: CAGR 2.80% projection.
| Year | Annual Salary | Status |
|---|---|---|
| 2019 | $130,915 | Actual |
| 2020 | $135,666 | Actual |
| 2021 | $140,011 | Actual |
| 2022 | $147,423 | Actual |
| 2023 | $150,838 | Actual |
| 2024 | $186,692 | Actual |
| 2025 | $155,729 | Actual |
| 2026(current) | $160,089 | Estimated |
| 2027 | $164,572 | Projected |
Based on 7 years of BLS OEWS data for the Richland metropolitan area, the median cloud architect salary grew 19.0% from $130,915 (2019) to $155,729 (2025). At a 2.80% compound annual growth rate, salaries are projected to reach $164,572 by 2027 — a total increase of $33,657 (25.71%) from 2019.
Note: Historical values (2019–2025) are actual BLS OEWS figures for the Richland metropolitan area, sourced from annual Occupational Employment and Wage Statistics surveys. 2026–2026 figures are current estimates, and 2027 values are projections, calculated using a 2.80% CAGR derived from 7-year BLS historical data. Actual salaries may vary based on employer, experience, certifications, and local market conditions.
Salary by Experience Level
| Experience | Estimated Salary Range |
|---|---|
| 0-2 years (New Graduate) | $94,939 – $123,383 |
| 3-5 years (Mid Career) | $123,383 – $160,089 |
| 5+ years (Experienced) | $160,089 – $198,791 |
| 10+ years (Top Earner) | $198,791 – $236,582 |
CA salary ranges estimated from BLS percentile data. Individual cloud architect compensation varies by employer, certifications, and specialization.
Cloud Architect Job Market in Richland
The local job market for cloud architects shows strength, with 15 professionals currently employed, yet the cost of living index stands at 107.4, slightly above the national average. This index implies that while salaries are substantial, take-home purchasing power can be affected. Among employers, consulting firms such as Accenture or Deloitte tend to offer the highest salaries, followed closely by financial and healthcare sectors that prioritize cloud security. Variances in pay stem from factors such as cloud platform specialization, professional certifications, and consulting tier partnerships. Currently, expertise in AWS solutions leads the market, particularly in multi-cloud environments and FinOps, which are increasingly relevant due to rising cloud costs. For cloud architects in Richland, obtaining certifications like the AWS Solutions Architect Professional or Azure SAA Expert can significantly enhance pay potential, making it crucial to factor these credentials in when considering the local market's compensation dynamics.
More salary data for Richland, WA:
Frequently Asked Questions
How much do cloud architects make in Richland, WA in 2026?
Is Richland, WA a good place to work as a cloud architect?
Can cloud architects make $100K in Richland?
What is the cost-of-living adjusted cloud architect salary in Richland?
How much does a cloud architect make per hour in Richland?
Related Pages
Compare Salaries
Career Resources
Nearby Cities in Washington
Written by Maria Gonzalez, MS
Career Analyst
Maria has 10 years of experience in cloud architecture. She specializes in cloud security and compliance. She works in a technology consulting firm.
Methodology & Data Source
Salary figures on this page are 2026 projections based on the Bureau of Labor Statistics Occupational Employment and Wage Statistics (OEWS) survey, May 2026 release. The BLS reported a median annual salary of $155,729 for cloud architectsin the Richland metropolitan area. A 2.80% compound annual growth rate (CAGR), calculated from 6-year national BLS wage trends, was applied to project current 2026 compensation. Percentile ranges (P10–P90) represent the full salary distribution across experience levels and practice settings in this market.
Data Sources & Methodology
Salary data for Richland is estimated from official BLS state-level occupational wage data (2025), adjusted for regional cost-of-living differences using BEA RPP (Regional Price Parities).
2026 figures are projected from 2025 BLS data using a compound annual growth rate (CAGR) of 2.80%, derived from historical BLS wage trends for cloud architects (SOC 15-1241).
Compiled and verified by Maria Gonzalez, MS, a licensed cloud architect with 10+ years of clinical experience. · View source data at BLS.gov